Ask a room of investors which metric matters most and you will start an argument. One camp swears by cap rate; the other by cash-on-cash return. Both are right, because cap rate and cash-on-cash answer completely different questions. Using the wrong one for your situation leads to bad offers on good properties, or worse, good offers on bad ones.
Two investors, one conversation:
"I found a fourplex at a 6% cap rate."
"Sure, but what's the cash-on-cash after the mortgage?"
If the first investor cannot answer, this guide is for them.
Cap rate: the building's report card
Cap Rate = NOI ÷ Purchase Price
Cap rate measures the unlevered return, what the building earns as a percentage of its price if you paid all cash. Because it ignores financing, it describes the property in its market, not your deal.
Example. A fourplex produces $32,000 of NOI and lists for $530,000. Cap rate = $32,000 ÷ $530,000 = 6.0%.
When cap rate is the right tool
- Comparing properties across a market or to each other. Financing differs; buildings do not.
- Estimating value. Value = NOI ÷ market cap rate. If similar fourplexes trade at 6% and this one produces $32,000, income supports about $533,000.
- Reading risk. Higher cap rates generally signal more risk (a weaker area, an older building, less stable tenants); lower cap rates signal stability and appreciation expectations.
- Commercial and DSCR lending. Lenders size loans off NOI.
Where cap rate misleads you
- It ignores leverage. A 5% cap property with cheap fixed debt can outperform a 7% cap property with expensive variable debt.
- It ignores closing costs, initial repairs, and the reserves you had to fund.
- On 2-4 unit buildings, sales are still partly comparable-driven, so "market cap rates" are fuzzier than in commercial.
Cash-on-cash return: your money's report card
Cash-on-Cash = Annual Pre-Tax Cash Flow ÷ Total Cash Invested
Cash flow is NOI minus annual debt service. Cash invested is everything you put in: down payment, closing costs, initial repairs, and reserves funded at closing. Cash-on-cash measures what your actual dollars earn after financing, the metric for a leveraged investor.
When cash-on-cash is the right tool
- Deciding whether to buy this deal with your financing.
- Comparing real estate against other uses of the same cash on a cash-yield basis.
- Evaluating value-add plans: will $30,000 of renovation raise rents enough to move cash-on-cash from 3% to 9%?
The same building at four leverage levels
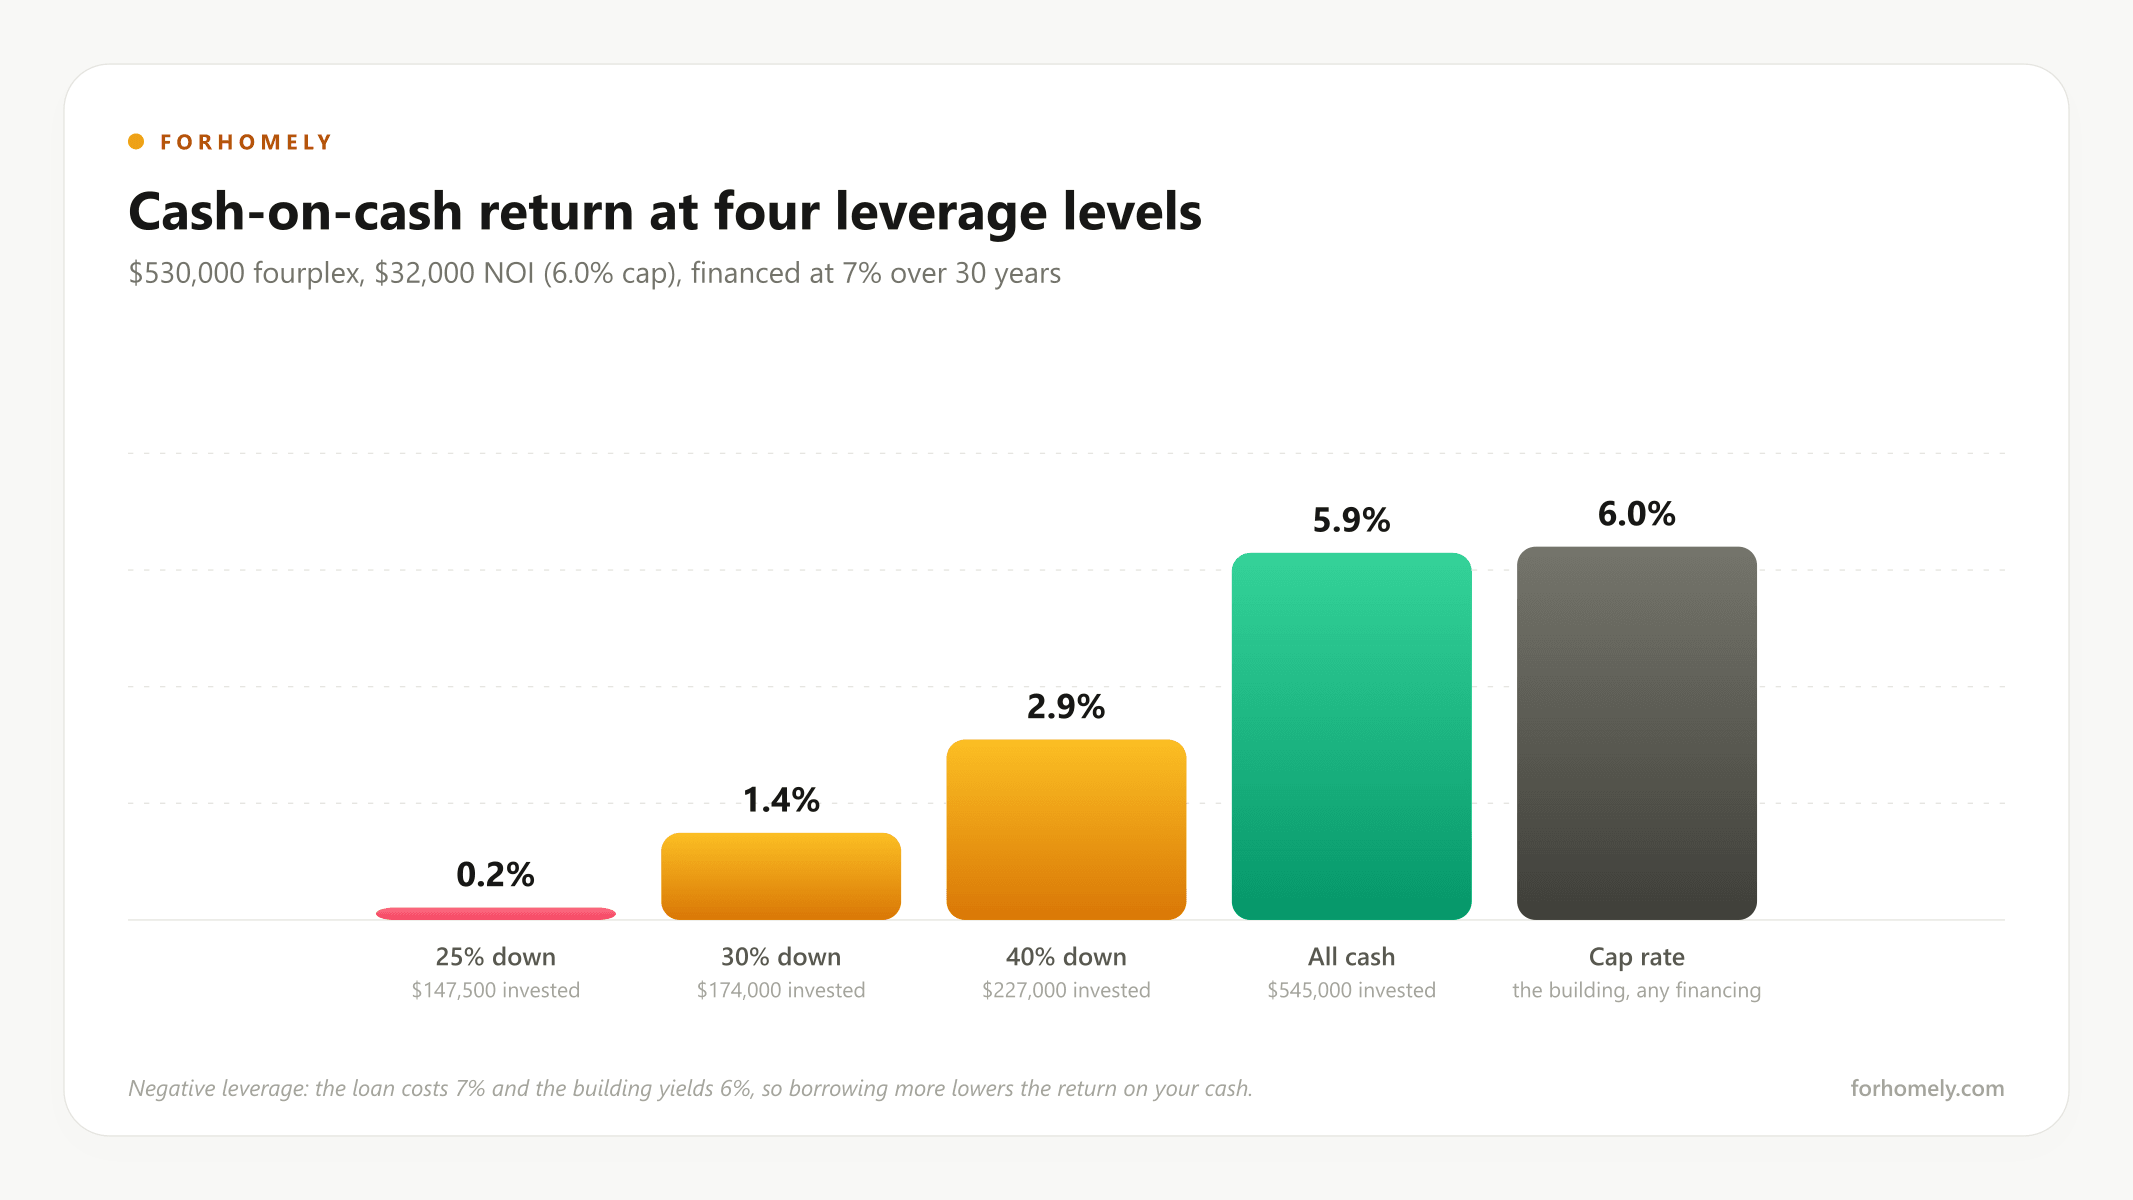
Take the $530,000 fourplex with $32,000 of NOI, financed at 7% on a 30-year loan, with $15,000 of closing costs in every case.
| Down payment | Loan | Annual debt service | Cash flow | Cash invested | Cash-on-cash |
|---|---|---|---|---|---|
| 25% ($132,500) | $397,500 | $31,738 | $262 | $147,500 | 0.2% |
| 30% ($159,000) | $371,000 | $29,617 | $2,383 | $174,000 | 1.4% |
| 40% ($212,000) | $318,000 | $25,388 | $6,612 | $227,000 | 2.9% |
| 100% ($530,000) | $0 | $0 | $32,000 | $545,000 | 5.9% |
The cap rate is 6.0% in every row. The cash-on-cash return ranges from 0.2% to 5.9%, and it rises as leverage falls. That is negative leverage: the building yields 6% and the debt costs 7%, so every borrowed dollar loses a penny a year. The most-leveraged buyer, the one who "put the least money down," earns almost nothing on the cash he did put in.
Now change one number. At a 5.5% interest rate, the 25%-down buyer's debt service falls to $27,083, cash flow rises to $4,917, and cash-on-cash is 3.3%, still below the all-cash 5.9%, but the gap has narrowed. At a 4.5% rate, cash-on-cash at 25% down is 5.5%, and at a 4% rate it finally exceeds the all-cash return. Positive leverage begins where the loan rate falls below the cap rate. This is the tension between the two metrics, and it is exactly why you need both.
The quick decision table
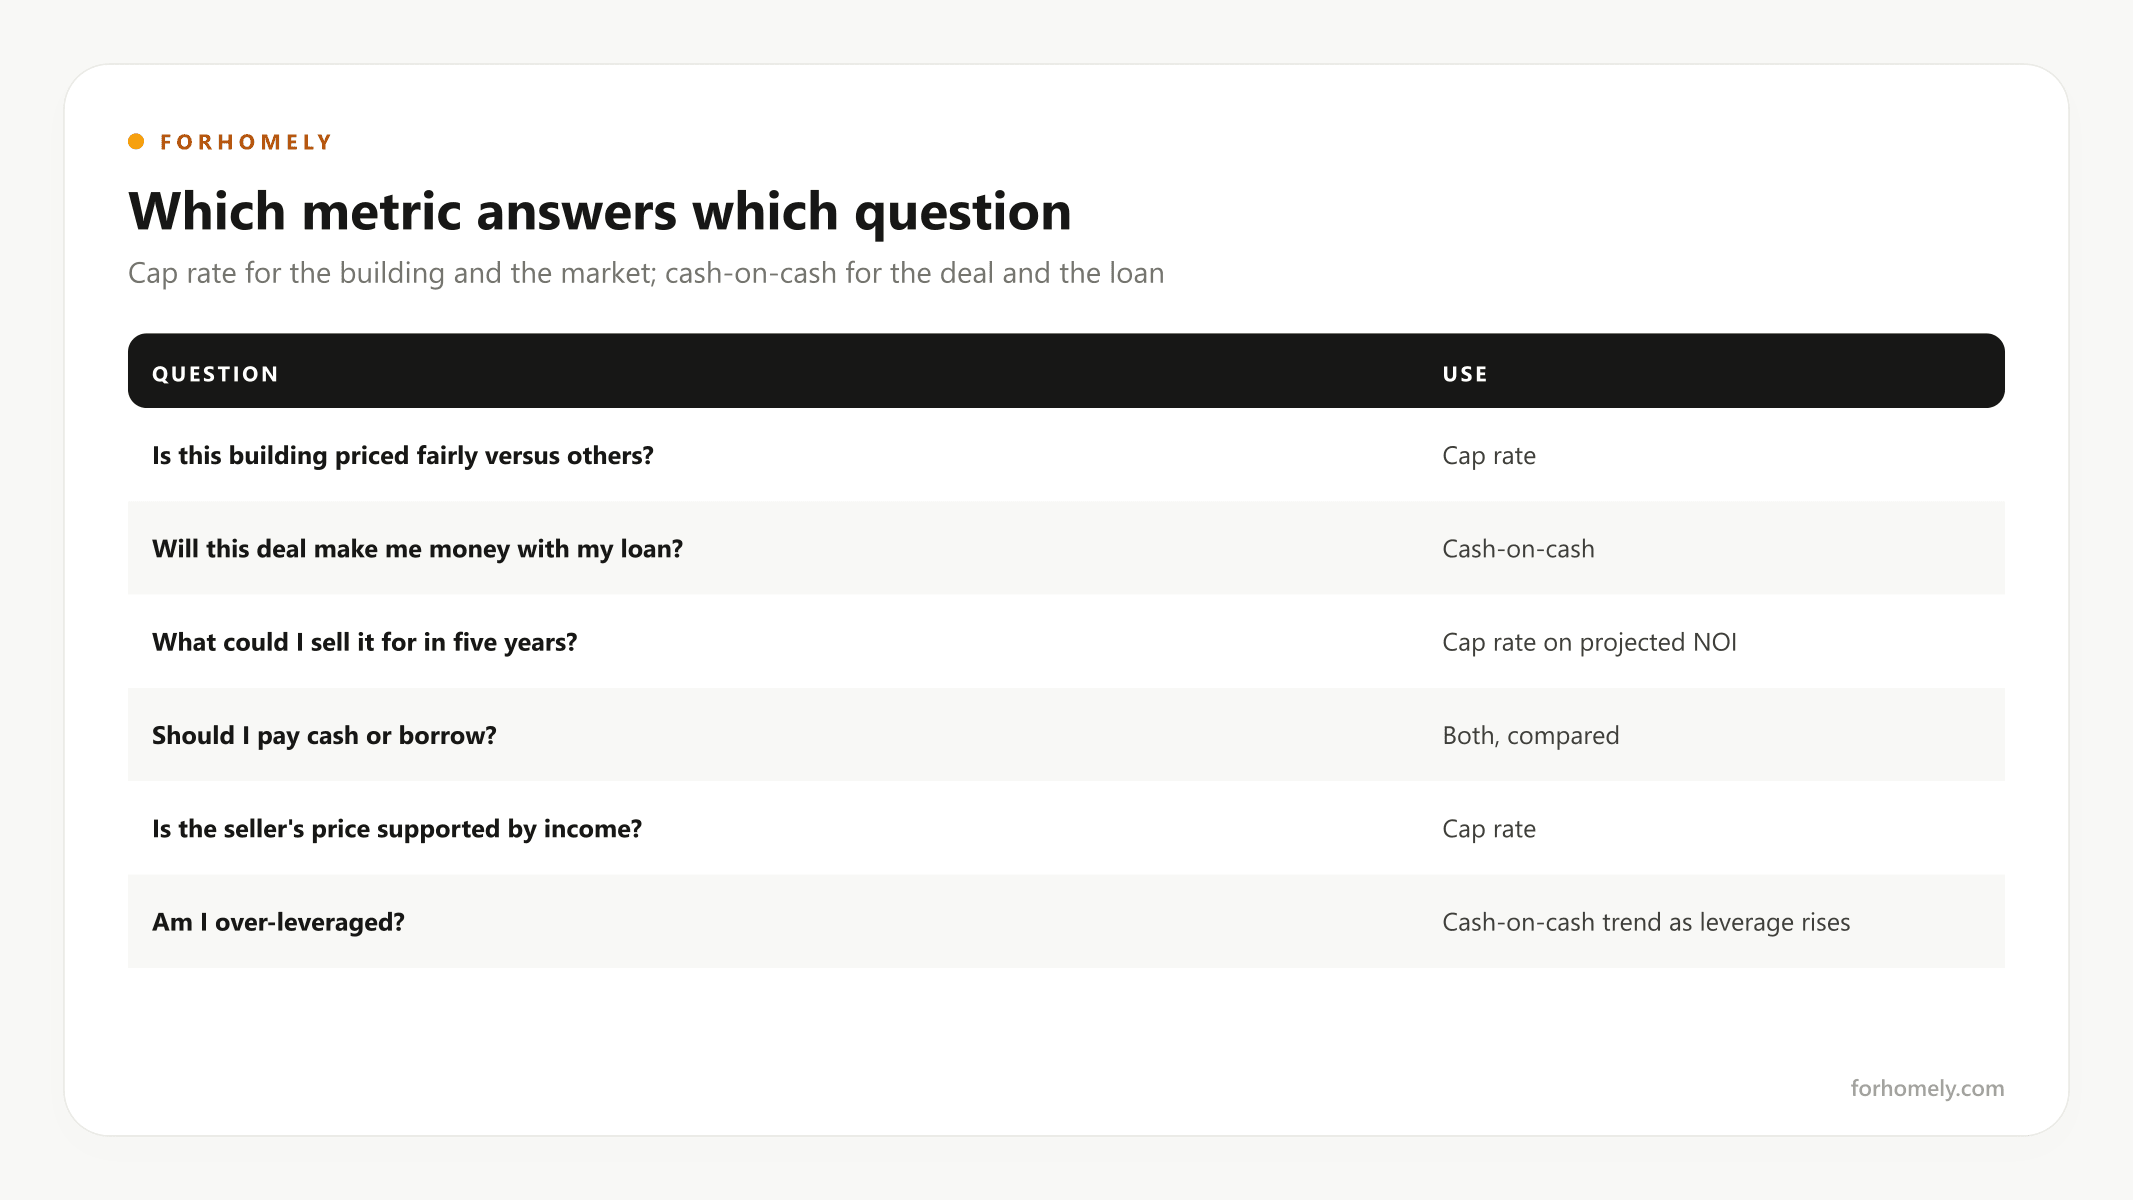
| Question | Use |
|---|---|
| Is this building priced fairly versus others? | Cap rate |
| Will this deal make me money with my loan? | Cash-on-cash |
| What could I sell it for in five years? | Cap rate on projected NOI |
| Should I pay cash or borrow? | Both, compared |
| Does it qualify for a DSCR loan? | Neither directly; rent ÷ PITIA |
| Is the seller's price supported by income? | Cap rate |
| Am I over-leveraged? | Cash-on-cash trend as leverage rises |
Rules of thumb for 2-4 unit properties
- In most Midwest and Southeast markets, 6-8% cap rates are common for small multifamily; coastal metros often trade at 4-5%.
- A cash-on-cash return of 8-12% is a solid target for a leveraged small multifamily purchase; below 4-5%, you are relying on appreciation and paydown.
- If the cap rate is below your mortgage rate, leverage will reduce your cash flow. The deal must then be justified by rent growth, appreciation, or amortization, and you should write down which one you are betting on.
- A cash-on-cash return far above the cap rate is a warning, not a triumph. It usually means very high leverage on a thin margin, and one vacancy erases it.
The trap that catches new investors
A buyer finances aggressively, 15% down through a portfolio lender, on a building with a 3.8% cap rate, and celebrates a 9% first-year cash-on-cash return produced by a below-market teaser rate. Five years later the rate resets, cash flow collapses, and no lender will refinance a $300,000 property that produces $11,000 of NOI. Meanwhile, the investor who bought a 6.5% cap building with 25% down and a boring fixed rate earned 5% cash-on-cash every year, refinanced twice to pull equity, and never worried about a vacancy.
The cap rate told the truth about the first building from the beginning. The cash-on-cash return hid it for a while.
Calculate both instantly
The Multifamily Cash Flow Calculator outputs cap rate and cash-on-cash return side by side, so you can see exactly how your loan terms convert a property's yield into your personal return. If cash-on-cash is far above cap rate, ask why before you sign. And if you have not built the NOI yet, start with how to calculate NOI; both metrics are only as good as that number.